What Is a Strength Map in 3D Design?
A strength map is a visual way to review a 3D model before you print or make it. Instead of guessing where a part may need more attention, you can look at the model as a whole and focus on the areas that deserve a closer check.
What it helps you spot
The map is most useful when a design has a mix of thick and thin areas. It can draw your attention to a narrow neck between two larger forms, a sharp inside corner, a thin wall near a mounting hole, or a sudden change in shape.
- Thin sections that may need another look
- Sharp transitions where stress can concentrate
- Detailed areas where a small design change may matter more than expected
How to use it before printing
Start with the shape you already have. Run the Strength Map, then compare the highlighted areas with the actual job the part needs to do. A hook, bracket, clip, or mounting tab usually has an obvious load path. Check whether the area that looks most demanding in the map also makes sense in the real object.
If it does, try a small change instead of rebuilding the part: thicken one wall, widen a transition, soften a sharp corner, or add a little material where the part joins another section. Run the check again and compare the two versions. That is often faster than printing the first idea and discovering the weak point afterward.
What can change the result
The geometry is only one part of the story. Two identical models can behave very differently depending on how they are made.
- Material: PLA, PETG, ABS, and other materials do not fail in the same way.
- Print orientation: Layer direction can be as important as the shape itself.
- Wall thickness and infill: These settings change how much material carries the load.
- Real use: A static shelf bracket and a part that is repeatedly flexed need different thinking.
A guide, not a guarantee
A Strength Map is an early design tool. It is not a replacement for physical testing, a print sample, or certified engineering analysis. Use it to make better decisions before you spend time and material—not as a promise that a finished part will be safe in every situation.
Quick questions
Should I change every highlighted area?
No. Start with the areas that are both highlighted and important to the part’s real job.
Can it tell me whether a part will never break?
No. It helps you decide where to inspect and improve a design before testing it in the real world.
When should I run it?
Use it after you have the basic shape, then run it again after meaningful changes to walls, joints, holes, or supports.
Practice: compare one change to the same model
Use a non-critical practice model with a visibly narrow section, such as a decorative stand. The aim is to learn how a geometry change affects the relative map. This exercise does not establish a safe load or certify a printable part.
- Keep a baseline. Save the original project before editing. Record the model’s dimensions and the section you want to examine. Check the project-saving tools if you need help keeping a recoverable copy.
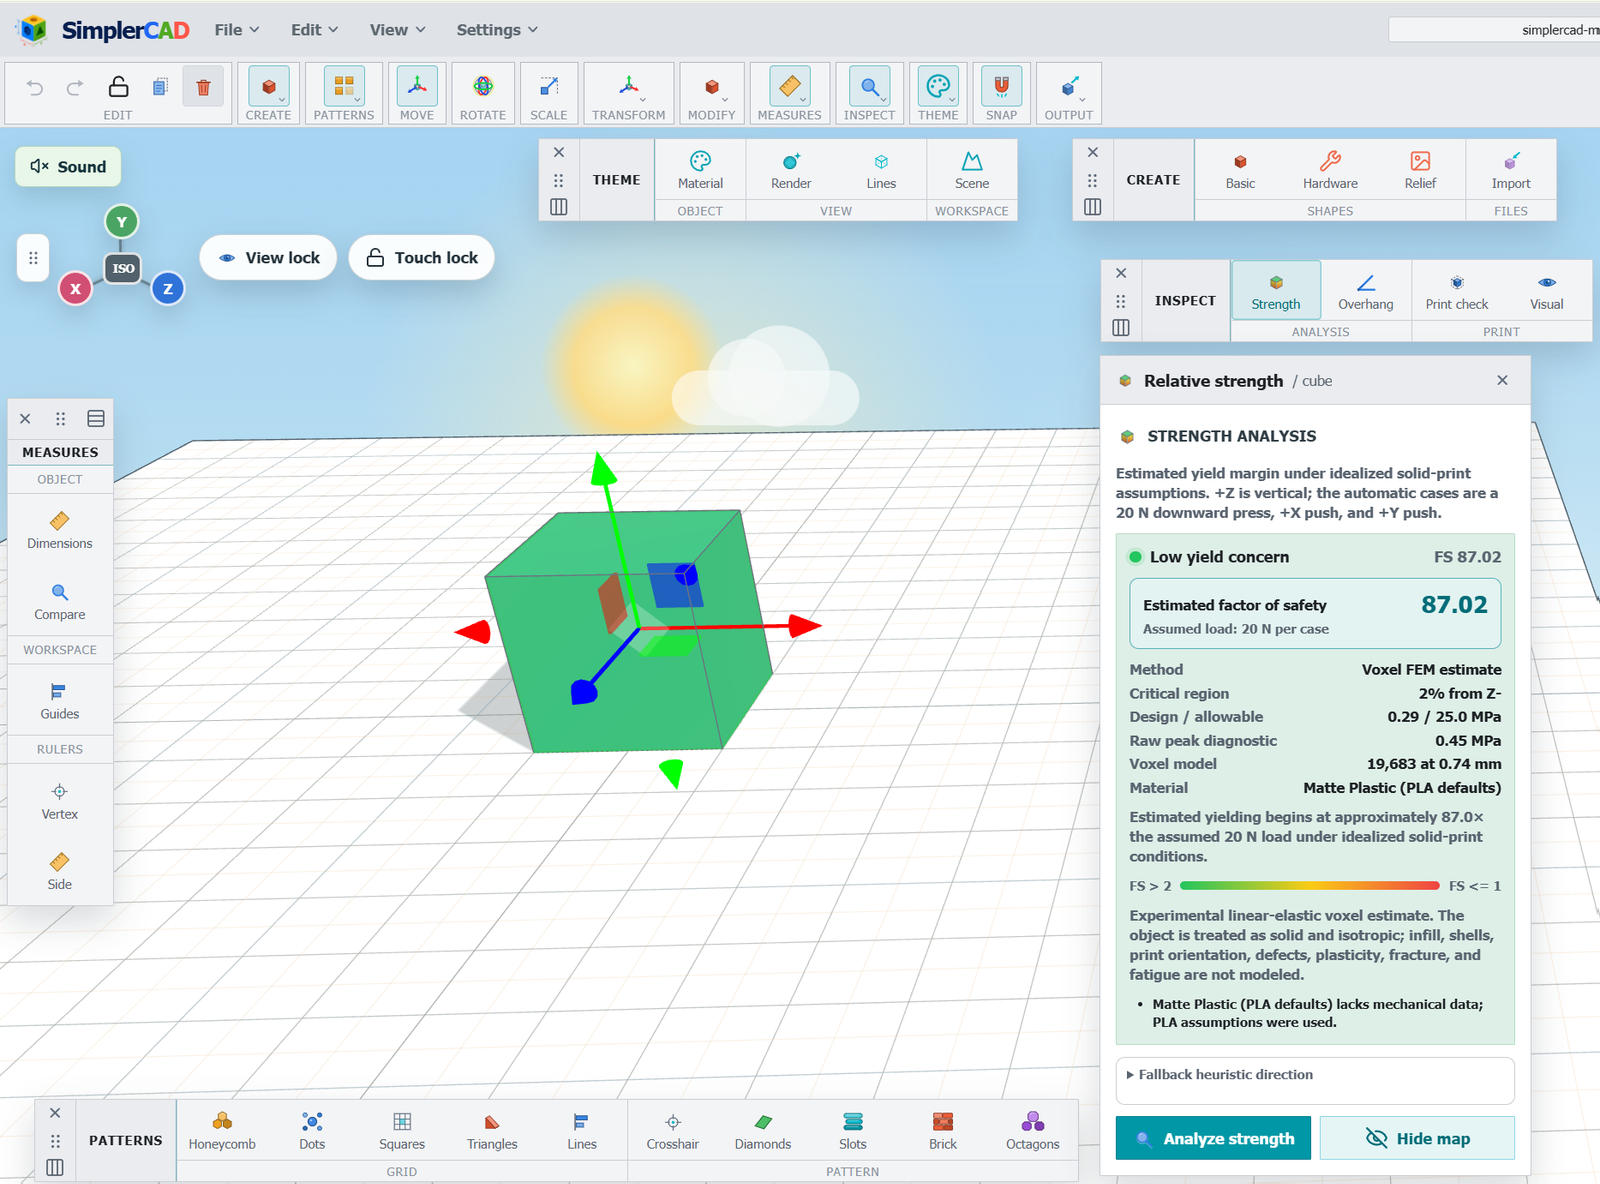
- Review the first map. Use the relative strength analysis. Inspect the risk reported for each axis and the critical-section location. Record which section is highlighted; do not assume every highlight identifies the same kind of loading.
- Change one feature. Make the narrow section wider while keeping the model’s overall scale and orientation the same. Use the measurement tools to check the edited dimension. Changing only one feature makes the comparison easier to interpret.
- Run the same check again. Compare the same axis and analysis settings. Look for changes in the reported risk and critical-section location. The weakest region may move elsewhere even when the edited section improves.
- Keep both versions. Save the edited model separately. Record what changed, the settings you used, and what the two results showed. A useful comparison needs more than two different-looking color maps.
A simple comparison record
- Baseline and revised project names
- The dimension changed, with its before-and-after values
- Analysis axis and settings used for both runs
- Reported risk and critical-section location for each version
- Questions still requiring a print sample or other testing
Read the map alongside the other checks
Relative strength analysis, overhang analysis, and mesh checks answer different questions. A change that improves one comparison can still leave an open edge, create a printing overhang, or change how a part fits. Use the separate checks described in the manual, then inspect the exported model in your slicer.
Keep material, print orientation, walls, and infill in your notes when you eventually compare physical samples. The map is based on geometry; it does not reproduce all of the conditions that determine how a real print behaves.
Try it on your own design
Build a simple part, review it with the Strength Map, make one focused change, and compare the result. That small loop is where the tool becomes useful.